
Q657
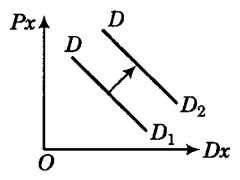
Shifts in demand curve as shown in the figure below represents
Shifts in demand curve as shown in the figure below represents
A.
extension of demand
B.
increment of demand
C.
increase of demand
AnswerD.
expansion of demand
Answer: Option C
Solution
Answer: Option C
No explanation is given for this question Let's Discuss on Board