
Q42
The figure shows a constant current source charging a capacitor that is initially uncharged. If the switch is closed at t = 0, which of the following plots depicts correctly the output voltage of the circuit as a function of time?
The figure shows a constant current source charging a capacitor that is initially uncharged.
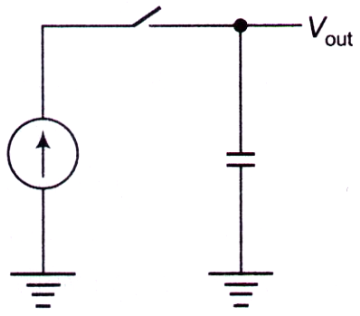
If the switch is closed at t = 0, which of the following plots depicts correctly the output voltage of the circuit as a function of time?
If the switch is closed at t = 0, which of the following plots depicts correctly the output voltage of the circuit as a function of time?
A.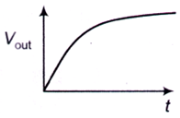 Answer
B.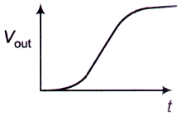
C.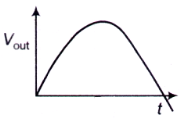
D.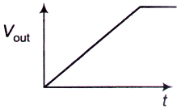
Answer: Option A
Solution
Answer: Option A
No explanation is given for this question Let's Discuss on Board