
Q142
The following figure represents the velocity-time graph of a moving car on a road. Which segment of the graph represents the retardation?
The following figure represents the velocity-time graph of a moving car on a road.
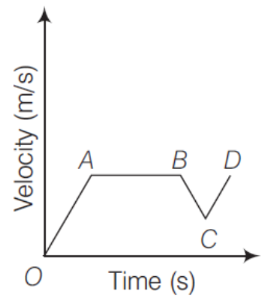
Which segment of the graph represents the retardation?
Which segment of the graph represents the retardation?
A.
AB
B.
BC
AnswerC.
CD
D.
None of these
Answer: Option B
Solution
Answer: Option B
No explanation is given for this question Let's Discuss on Board