
Q65
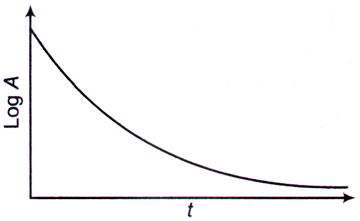
The plot of log A vs time t, where A is activity as shown in the figure, corresponds to decay
The plot of log A vs time t, where A is activity as shown in the figure, corresponds to decay
A.
from only one kind of radioactive nuclei having same half life
AnswerB.
from only neutron activated nuclei
C.
from a mixture of radioactive nuclei having different half lives
D.
which is unphysical
Answer: Option A
Solution
Answer: Option A
No explanation is given for this question Let's Discuss on Board