
Q171
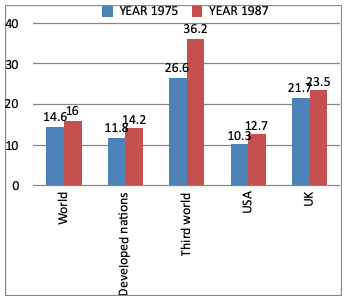
Direction (1 - 3): Study the following bar graph and answer the questions. The Bar graph gives the annual rates of inflation in percentage for 1975 and 1987.
Direction (1 - 3): Study the following bar graph and answer the questions. The Bar graph gives the annual rates of inflation in percentage for 1975 and 1987.
Options are not available for this question.