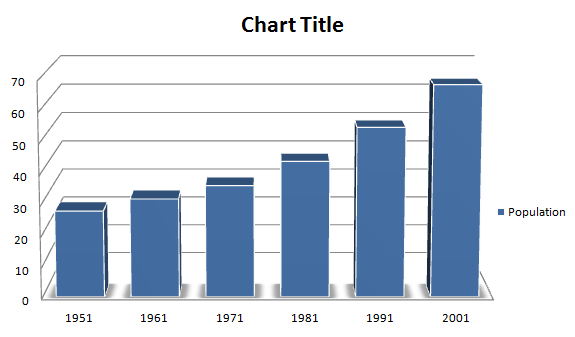
Directions (1 - 4): Study the graph and answer the questions:
The bar chart give
Options are not available for this question.
Select an option to see the answer and solution.
The percent increase in population from 1991 to 2001 is:
A. 24.8 crores
B. 20 crores
C. 13.6 crores
D. 22.9 crores
Select an option to see the answer and solution.
In which census year, the per cent increase in population is highest as compared to that in the previous census year?
Select an option to see the answer and solution.
In which census year, the per cent increase in population is least as compared to that in the previous census year?
Select an option to see the answer and solution.
Per year increase in population from the year 1951 to 2001 is
A. 8100000
B. 7600000
C. 8900000
D. 6700000
Select an option to see the answer and solution.
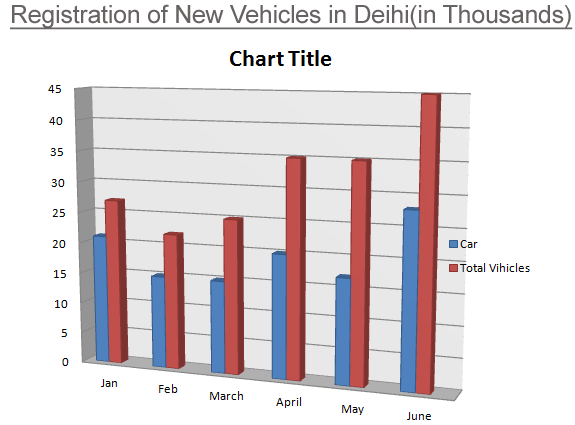
Directions (1 - 5): Study the graph and answer the questions:
Options are not available for this question.
Select an option to see the answer and solution.
What was the increase in registration of vehicles other than Cars from January to April 1991?
A. 5000
B. 10000
C. 15000
D. no increase
E. None of These
Select an option to see the answer and solution.
What is the difference between the number of cars registered in January and those registered in June?
A. 2000
B. 6000
C. 5000
D. no difference
E. None of These
Select an option to see the answer and solution.
Which was the following month was the registration of vehicles other than Cars maximum?
A. April
B. June
C. May
D. February
E. January
Select an option to see the answer and solution.
What was the number of vehicles other than Cars registered in March, 1991?
A. 5000
B. 10000
C. 40000
D. 37000
E. None of these.
Select an option to see the answer and solution.
What was the percentage increase in registration of Cars from February to March 1991?
A. 0%
B. 1%
C. 2%
D. 2.5%
E. None of these
Select an option to see the answer and solution.
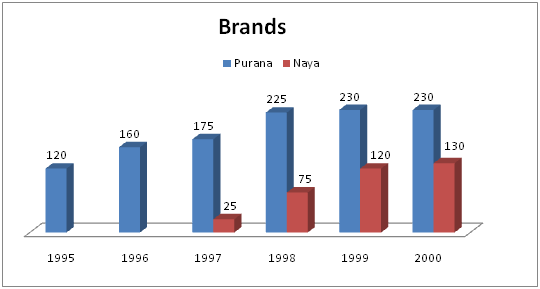
Directions (1 - 3) : Purana and Naya two brand of mixer-grinder available in the market. Purana was introduced in 1990 and Naya was introduced in 1997. For both brands, 20% of the mixer-grinder bought in a particular year are disposed off as junk exactly two year later. It is known that 10 Purana mixer-grinder were disposed off in 1997. The following chart show the operation from 1995 to 2000, as at end of the year.
Options are not available for this question.
Select an option to see the answer and solution.
How many Naya mixer-grinder disposed off by end of 2000 ?
A. 10
B. 15
C. 22
D. Cannot determined
Select an option to see the answer and solution.
How many Naya mixer-grinders were purchased in 1999?
Select an option to see the answer and solution.
How many Purana mixer-grinder disposed off in 2000?
A. 0
B. 5
C. 6
D. Cannot determined
Select an option to see the answer and solution.
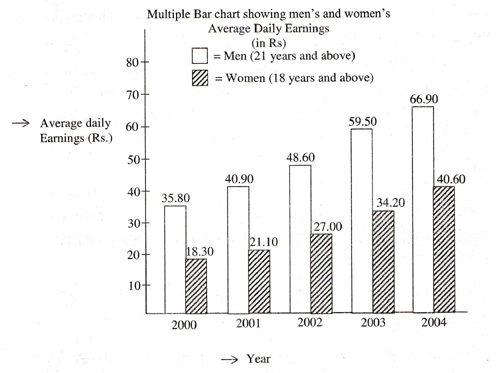
Direction (1 - 3) : The following is a multiple bar chart showing men's and women's average daily earnings in certain industries. Study the chart and answer the questions given below.
Options are not available for this question.
Select an option to see the answer and solution.
In which year is the percentage increase in the average daily earnings of men over the preceding year, the maximum ?
Select an option to see the answer and solution.
The difference between the average daily earnings of men and women over successive years :
A. Increase
B. Decrease
C. Remains the same
D. None of these
Select an option to see the answer and solution.
In which year is the ratio of men's average daily earnings to women's average daily earnings is the highest ?
A. 2000
B. 2001
C. 2002
D. 2003
E. 2004
Select an option to see the answer and solution.
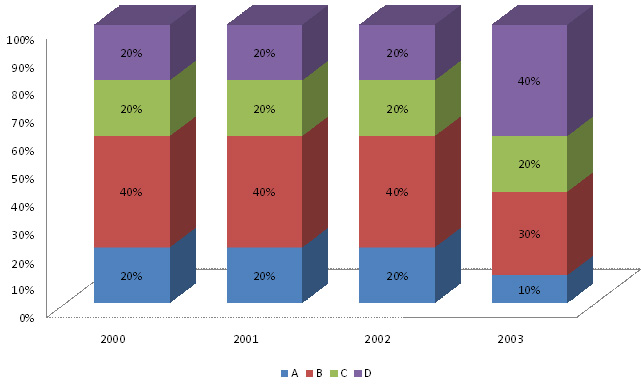
Directions (1 - 5): The cumulative bar chart below gives us the production of four Products A, B, C and D for four years. It is known that the total production increases @20% over its value in the previous year. The difference between C's production in 2003 and A's production in 2001 is 2640 units.
Production of A, B, C and D.
Options are not available for this question.
Select an option to see the answer and solution.