
Q110
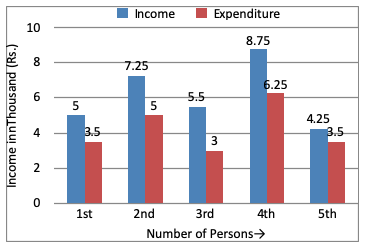
Directions (1 - 2): In the following questions, a graphical representation of income and expenditure of 5 persons during the month of January has been given. Read the graph and answer the questions.
Directions (1 - 2): In the following questions, a graphical representation of income and expenditure of 5 persons during the month of January has been given. Read the graph and answer the questions.
Options are not available for this question.