
Q1
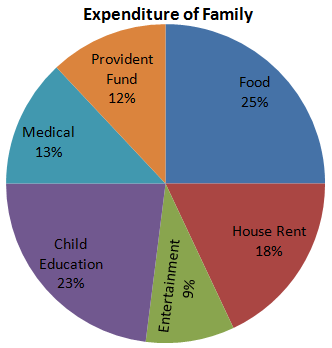
Directions (1 - 4): Study the chart and answer the questions: The pie chart given here represents the domestic expenditure of a family in percent. Study the chart and answer the following questions if the total monthly income of the family is Rs. 33,650
Directions (1 - 4): Study the chart and answer the questions:
The pie chart given here represents the domestic expenditure of a family in percent. Study the chart and answer the following questions if the total monthly income of the family is Rs. 33,650
Options are not available for this question.