Directions (1 - 4): Study the chart and answer the questions:
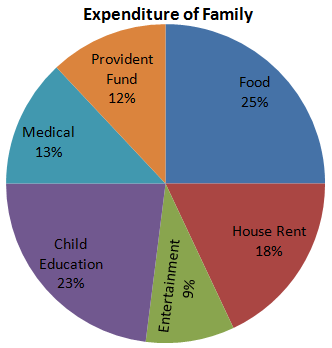
The pie chart given here represents the domestic expenditure of a family in percent. Study the chart and answer the following questions if the total monthly income of the family is
Rs. 33,650
Options are not available for this question.
Select an option to see the answer and solution.
The house rent per month is:
A. Rs. 6000
B. Rs. 6152
C. Rs. 6057
D. Rs. 6048
Select an option to see the answer and solution.
The annual savings in the form of provident fund would be:
A. Rs. 48456
B. Rs. 48540
C. Rs. 44856
D. Rs. 45480
Select an option to see the answer and solution.
After providential fund deductions and payment of house rent, the total monthly income of the family remains:
A. Rs. 23545
B. Rs. 24435
C. Rs. 23555
D. Rs. 25355
Select an option to see the answer and solution.
The total amount per month, the family spends on food and entertainment combined together, is:
A. Rs. 11432
B. Rs. 11441
C. Rs. 12315
D. Rs. 12443
Select an option to see the answer and solution.
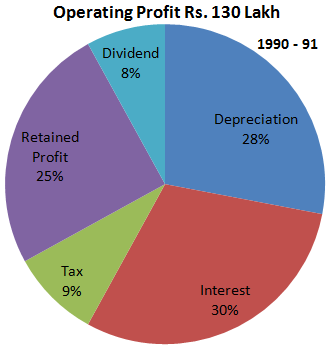
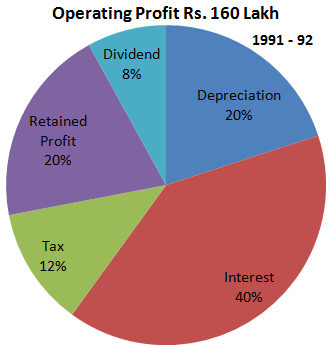
Directions (1 - 5): Study the chart and answer the questions:
Options are not available for this question.
Select an option to see the answer and solution.
The operating Profit in 1991-92 increased over in 1990-91 by
Select an option to see the answer and solution.
The interest burden in 1991-92 was higher than that in 1990-91 by
A. 50%
B. Rs. 25 lakh
C. 90%
D. Rs. 41 lakh
Select an option to see the answer and solution.
If on an average, 20% rate of interest was charged on borrowed funds, then the total borrowed funds used by this company is the given 2 yr amounted to
A. Rs 221 lakh
B. Rs 195 lakh
C. Rs 368 lakh
D. Rs 515 lakh
Select an option to see the answer and solution.
The retained profit in 1991-92, as compared to that in 1990-91 was:
A. Higher by 2.5 %
B. higher by 1.5%
C. lower by 2.5 %
D. lower by 1.5%
Select an option to see the answer and solution.
The equity base of those companies remained unchanged. Then, the total dividend earnings by the share holders in 1991-92 is
A. Rs 104 lakh
B. Rs. 9 lakh
C. Rs. 12.8 lakh
D. Rs 15.6 lakh
Select an option to see the answer and solution.
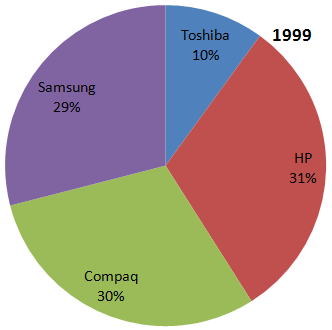
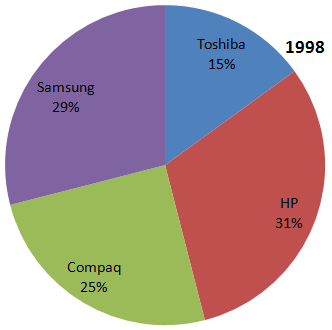
Directions (1 - 5): Based on the data given on the pie-chart. Solve the questions which follow :
Percentage Sales of different models of Computers in Kolkata in two different years . Given total sales in 1998 is 7890 and increase 16.5% in 1999.
Options are not available for this question.
Select an option to see the answer and solution.
The percentage change in the sales of Toshiba in 1999 is approximately :
Select an option to see the answer and solution.
Which brand of computers among those shown, exhibited the second highest rate of growth in two years and had less sales in 1999 than 1998?
A. HP
B. Compaq
C. Samsung
D. All of These
Select an option to see the answer and solution.
What is the ratio between the Compaq sales in 1998 and those IBM in 1999?
Select an option to see the answer and solution.
For which brand of computers, did the sales increase the maximum in terms of absolute value between the two years?
A. IBM
B. Samsung
C. HP
D. Compaq
Select an option to see the answer and solution.
IBM's sales in 1998 is what percentage of the sales of Samsung in 1999?
A. 46.34%
B. 52.34%
C. 57%
D. 60.8%
Select an option to see the answer and solution.
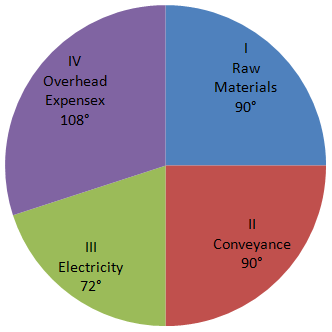
Directions (1 - 4): Study the pie chart and answer the given questions.
The total expenditure of a company for a particular month is Rs. 60000. The various heads of expenditure I to IV are indicated in a pie chart given below. These heads are:
Options are not available for this question.
Select an option to see the answer and solution.
What percentage of total expenditure is on electricity?
Select an option to see the answer and solution.
What percentage of total expenditure is on raw materials?
Select an option to see the answer and solution.