
Q146
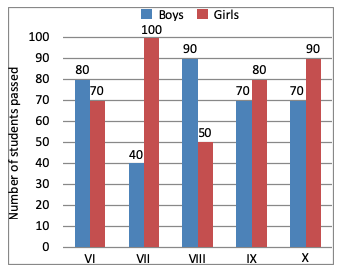
Directions (1 - 4): The bar graph shows the results of an annual examination in a secondary school in a certain year. Answer the following four questions based on this chart.
Directions (1 - 4): The bar graph shows the results of an annual examination in a secondary school in a certain year. Answer the following four questions based on this chart.
Options are not available for this question.