
Q26
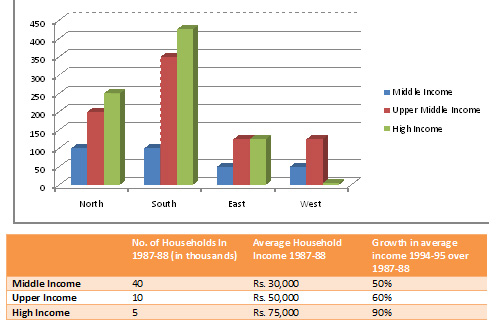
Directions (1 - 4) The following bar chart gives the growth percentage in the number of households in middle, upper-middle and high-income categories in the four regions for the period between 1987-88 and 1994-95.
Directions (1 - 4) The following bar chart gives the growth percentage in the number of households in middle, upper-middle and high-income categories in the four regions for the period between 1987-88 and 1994-95.
Options are not available for this question.