
Q175
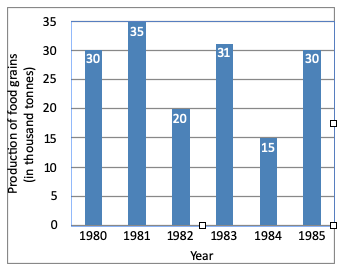
Directions (1 - 4): The graph shows the production of food grains of a country in different. Study the graph and answer the questions.
Directions (1 - 4): The graph shows the production of food grains of a country in different. Study the graph and answer the questions.
Options are not available for this question.