
Q12
Directions (1 - 5): Based on the data given on the pie-chart. Solve the questions which follow : Percentage Sales of different models of Computers in Kolkata in two different years . Given total sales in 1998 is 7890 and increase 16.5% in 1999.
Directions (1 - 5): Based on the data given on the pie-chart. Solve the questions which follow :
Percentage Sales of different models of Computers in Kolkata in two different years . Given total sales in 1998 is 7890 and increase 16.5% in 1999.
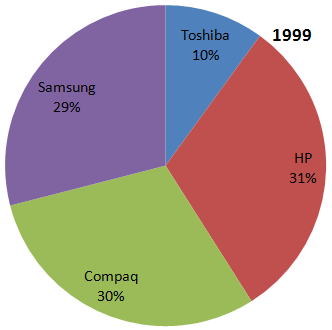
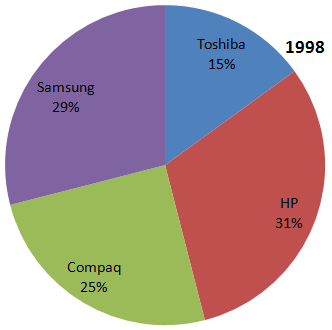
Percentage Sales of different models of Computers in Kolkata in two different years . Given total sales in 1998 is 7890 and increase 16.5% in 1999.
Options are not available for this question.