
Q32
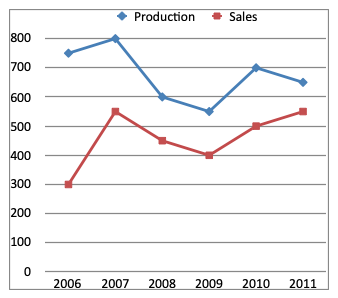
Directions (1 - 5): Study the following graph and answer the questions that follow: Production (in tonnes) and Sales (in tonnes) of Company A from 2006 to 2011. The table given below represents the ratio of the production (in tonnes) of Company A to the production (in tonnes) of Company B and the ratio of sales of Company A and Company B. Year Production (A : B) Sales (A : B) 2006 5 : 4 2 : 3 2007 8 :7 11 : 12 2008 3 : 4 9 : 14 2009 11 : 12 4 : 5 2010 14 : 13 10 : 9 2011 13 : 14 1 : 1
Directions (1 - 5): Study the following graph and answer the questions that follow:
Production (in tonnes) and Sales (in tonnes) of Company A from 2006 to 2011.
The table given below represents the ratio of the production (in tonnes) of Company A to the production (in tonnes) of Company B and the ratio of sales of Company A and Company B.
Production (in tonnes) and Sales (in tonnes) of Company A from 2006 to 2011.
The table given below represents the ratio of the production (in tonnes) of Company A to the production (in tonnes) of Company B and the ratio of sales of Company A and Company B.
| Year | Production (A : B) | Sales (A : B) |
| 2006 | 5 : 4 | 2 : 3 |
| 2007 | 8 :7 | 11 : 12 |
| 2008 | 3 : 4 | 9 : 14 |
| 2009 | 11 : 12 | 4 : 5 |
| 2010 | 14 : 13 | 10 : 9 |
| 2011 | 13 : 14 | 1 : 1 |
Options are not available for this question.