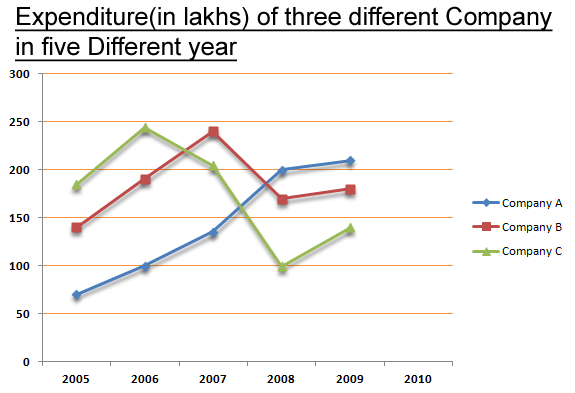
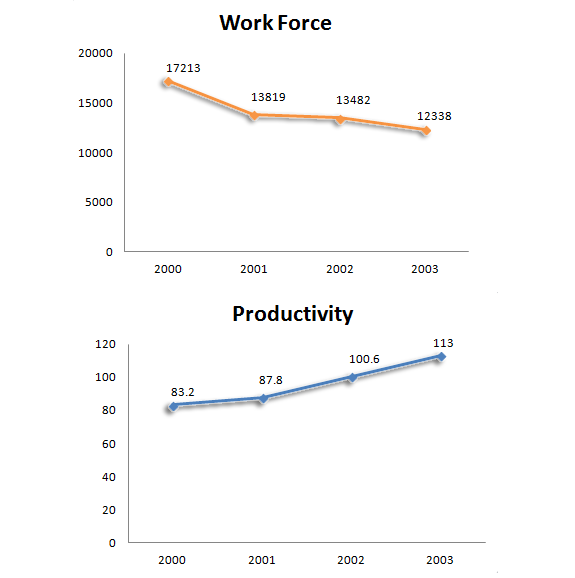
What was the difference between the total expenditure of company B in the year 2006 and 2008 together and the total expenditure of company C in the year 2007 and 2009 together?
Total expenditure of all three companies together in the year 2006 was what percentage of the total expenditure of company A overall the year together?
Directions (1 - 4): The following figure represents flow of natural gas through pipeline between major cities A, B, C, D and E (in suitable unit). Assume that supply equals demand. Refer to it and answer the following questions.-
Directions (1 - 3): The following sketch shows the pipeline carrying material from one location to another. Each location has a demand for material. The demand Vaishali is 400, at Jyotishmati is 400, at Panchal is 700 and Vidisha is 200. Each arrow indicates the direction of material flow through the pipeline. The flow from Vaishali to Jyotishmati is 300. The quantity of material flow is such that the demands at all these locations are exactly met. The capacity of each pipeline is 1.
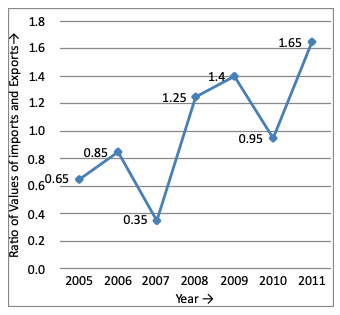
Directions (1 - 5): The following line – graph gives the ratio of the amounts of imports by a company to the amount of exports from that company over the period from 2005 to 2011.