
Q38
Directions (1 - 5): Study the following line graph carefully and answer the questions given below: Number of Students Appearing For Aptitude Test From Various Town (In Thousands).
Directions (1 - 5): Study the following line graph carefully and answer the questions given below:
Number of Students Appearing For Aptitude Test From Various Town (In Thousands).
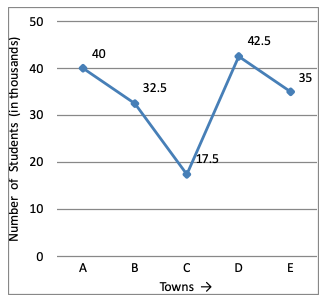
Number of Students Appearing For Aptitude Test From Various Town (In Thousands).
Options are not available for this question.