
Q85
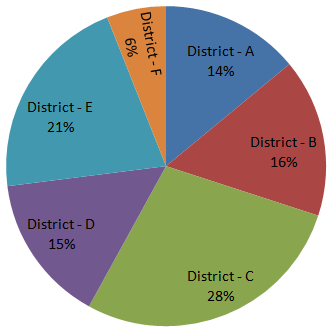
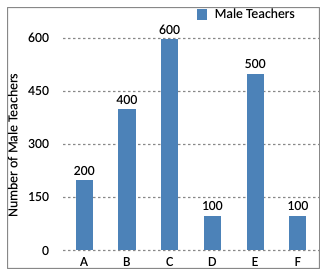
Directions (1 - 5): Study the following pie-chart and bar graph and answer the questions that follows: Percentage-wise distribution of Teachers in 6 Districts. Number of males in each district out of 4500 Teachers.
Directions (1 - 5): Study the following pie-chart and bar graph and answer the questions that follows:
Percentage-wise distribution of Teachers in 6 Districts.
Number of males in each district out of 4500 Teachers.
Percentage-wise distribution of Teachers in 6 Districts.
Number of males in each district out of 4500 Teachers.
Options are not available for this question.