
Q73
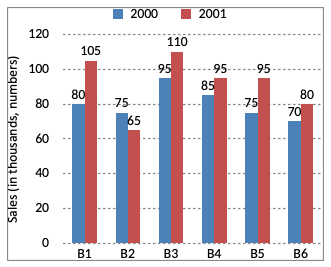
Directions (1 - 5): The bar graph given below shows the sales of books (in thousand numbers from six branches of a publishing company during two consecutive years 2000 and 2001. Sales of books (in thousands numbers) from six branches B1, B2, B3, B4, B5 and B6 of a publishing company in 2000 and 2001.
Directions (1 - 5): The bar graph given below shows the sales of books (in thousand numbers from six branches of a publishing company during two consecutive years 2000 and 2001. Sales of books (in thousands numbers) from six branches B1, B2, B3, B4, B5 and B6 of a publishing company in 2000 and 2001.
Options are not available for this question.