
Q20
Directions (1 - 5): The cumulative bar chart below gives us the production of four Products A, B, C and D for four years. It is known that the total production increases @20% over its value in the previous year. The difference between C's production in 2003 and A's production in 2001 is 2640 units. Production of A, B, C and D.
Directions (1 - 5): The cumulative bar chart below gives us the production of four Products A, B, C and D for four years. It is known that the total production increases @20% over its value in the previous year. The difference between C's production in 2003 and A's production in 2001 is 2640 units.
Production of A, B, C and D.
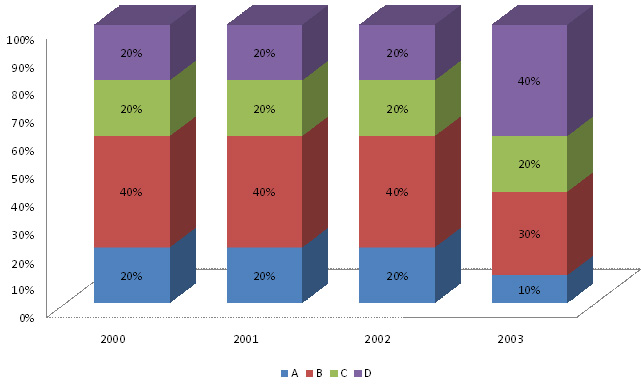
Production of A, B, C and D.
Options are not available for this question.