
Q20
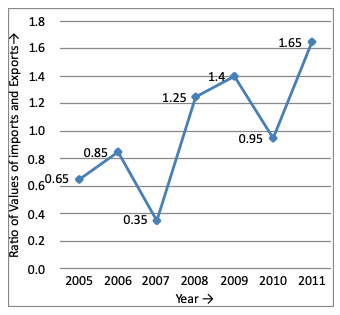
Directions (1 - 5): The following line – graph gives the ratio of the amounts of imports by a company to the amount of exports from that company over the period from 2005 to 2011.
Directions (1 - 5): The following line – graph gives the ratio of the amounts of imports by a company to the amount of exports from that company over the period from 2005 to 2011.
Options are not available for this question.