Q318
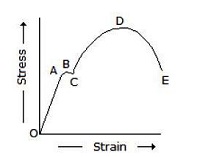
In the below figure, the point C represents
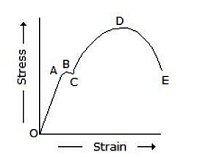
In the below figure, the point C represents
A.
Elastic limit
B.
Upper yield point
C.
Lower yield point
AnswerD.
Breaking point
Answer: Option C
Solution
Answer: Option C
Solution: