What is the total number of students having IB as specialisation?
A. 1520
B. 1280
C. 1360
D. 1120
E. None of these
Select an option to see the answer and solution.
What is the total number of students having specialisation in IR, marketing and IT?
A. 4640
B. 4080
C. 4260
D. 4400
E. None of these
Select an option to see the answer and solution.
What is the ratio of the students having finance as specialisation to students having HR as specialisation?
A. 11 : 19
B. 18 : 13
C. 6 : 7
D. 4 : 7
E. None of these
Select an option to see the answer and solution.
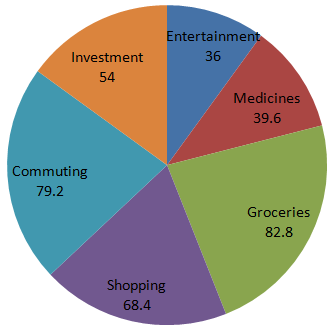
Directions (1 - 4): Study the following pie-chart carefully and answer the questions that follow:
Degreewise Break-up of Expenditure of a Family in a month
Total Amount Spent In a Month = Rs. 45800.
Options are not available for this question.
Select an option to see the answer and solution.
What is the total amount spent by the family on Entertainment and Shopping together?
A. Rs. 9618
B. Rs. 13282
C. Rs. 13740
D. Rs. 11908
E. None of these
Select an option to see the answer and solution.
What is the amount spent by the family on commuting?
A. Rs. 10076
B. Rs. 10534
C. Rs. 6870
D. Rs. 8702
E. None of these
Select an option to see the answer and solution.
The total amount spent by the family on Groceries, Entertainment and Investment together forms approximately what percent of the amount spent on Commuting?
A. 209%
B. 76%
C. 154%
D. 42%
E. 218%
Select an option to see the answer and solution.
What is the ratio of the amount spent by the family on medicine to the amount spent on groceries?
A. 1 : 2
B. 13 : 21
C. 3 : 5
D. 11 : 23
E. None of these
Select an option to see the answer and solution.
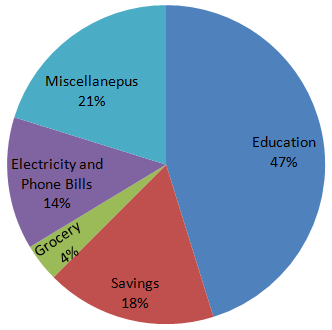
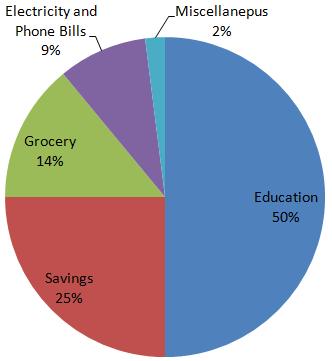
Directions (1 - 3): In the following question, study the two pie-charts and answer the questions.
April Month's Salary = Rs. 24000.
May Month's Salary = Rs. 25000.
Options are not available for this question.
Select an option to see the answer and solution.
From the salary of May, the amount spent on Grocery and Electricity are:
A. Rs. 6250, Rs. 3360
B. Rs. 960, Rs. 5040
C. Rs. 3500, Rs. 2250
D. Rs. 2160, Rs. 480
Select an option to see the answer and solution.
What is the percent increase in Education in May month than April month?
A. 9.56%
B. 12.35%
C. 20%
D. 10.82%
Select an option to see the answer and solution.
The ratio of amount spent for saving in April month’s salary and miscellaneous in May month’s salary is-
A. 216 : 25
B. 217 : 26
C. 205 : 13
D. 235 : 50
Select an option to see the answer and solution.
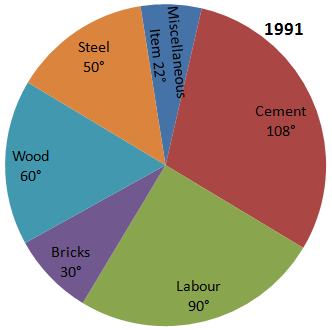
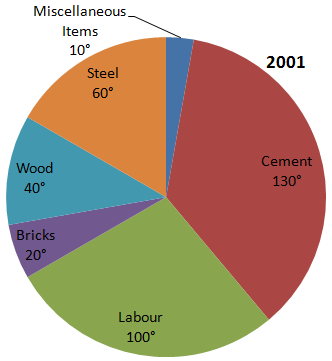
Directions (1 - 3): Pie-charts show the expenses on various heads show the expenses on various heads in construction of a house. Study the pie-chart.
Options are not available for this question.
Select an option to see the answer and solution.
If the total cost of constructing the house is Rs. 3,60,000 in 1991 and Rs. 8,64,000 in 2001, what is the amount spent on Steel in 1991 and 2001?
A. Rs. 2,16,000, Rs. 4,32,000
B. Rs. 60,000, Rs. 84,000
C. Rs. 80,000, Rs. 2,10,000
D. Rs. 50,000, Rs. 1,44,000
Select an option to see the answer and solution.
What percentage of the total amount is being spent on cement in 1991?
Select an option to see the answer and solution.
The percentage increase in the amount spent on labour from 1991 to 2001, given that the total amount spent on the construction of the house is Rs. 360000 in 1991 and Rs. 864000 in 2001 is:
A. 3 9 1
B. 43 3 1
C. 41 3 2
D. 166 3 2
Select an option to see the answer and solution.
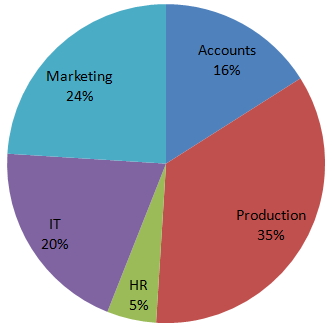
Directions (1 - 4): Study the pie-chart and table given below and answer the questions.
Details of the percentage of employees working in various departments in an organization and number of males among them.
Total number of employees = 800.
Department
No. of Males
Production
245
HR
12
IT
74
Marketing
165
Accounts
93
Options are not available for this question.
Select an option to see the answer and solution.
The percentage of females working in IT department to the total number of employees working in the organization is:
A. 10.25%
B. 10.75%
C. 15.25%
D. 15.75%
Select an option to see the answer and solution.
The respective ratio between the number of females working in HR department to the total number of employees working in the HR department is:
A. 7 : 10
B. 8 : 17
C. 8 : 19
D. 5 : 17
Select an option to see the answer and solution.
The ratio of number of males in marketing department to the number of females working in that department is:
A. 52 : 7
B. 25 : 9
C. 55 : 7
D. 55 : 9
Select an option to see the answer and solution.