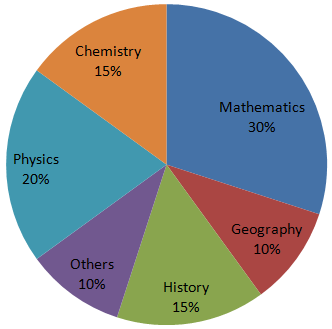
Directions (1 - 4): The following pie- chart shows the study- time of different subject of a student in a day. Study the pie chart and answer the following questions.
Options are not available for this question.
Select an option to see the answer and solution.
Instead of 10%, if the students spends 15% to study other subjects and the time is taken from the time scheduled to study mathematics and if he/she used to study 20 hours per day, then their difference of time for study mathematics per day is:
A. 30 minutes
B. 45 minutes
C. 1 hour
D. 1 hour 30 minutes
Select an option to see the answer and solution.
The time spent to study history and chemistry is 4 hours 30 minutes, Then the student studies physics for:
A. 1 hours 30 min
B. 2.9 hour (approx.)
C. 2 hours
D. 3 hours
Select an option to see the answer and solution.
If the student studies 10 hours in a day, then he/she studies mathematic for:
A. 3 hour
B. 3 10
C. 3 1
D. 10 3
Select an option to see the answer and solution.
If then student studies chemistry for 3 hours, then he/she studies geography for:
A. 1 hour
B. 2 hours
C. 1 hour 30 minutes
D. 2 hours 30 minutes
Select an option to see the answer and solution.
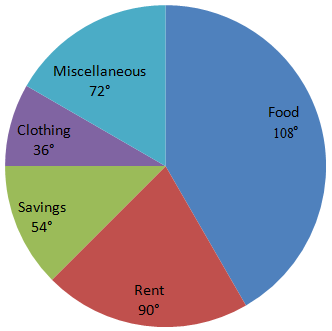
Direction (1 - 5): The following pie-chart shows the monthly expenditure of a family on various items. If the family spends Rs. 825 on clothing answer the questions.
Options are not available for this question.
Select an option to see the answer and solution.
The ratio of average of expenses on food, clothing and miscellaneous items to the average of expenses of on saving and rent is:
A. 3 : 2
B. 2 : 1
C. 1 : 3
D. 1 : 1
Select an option to see the answer and solution.
What percent of the total income does the family save.
Select an option to see the answer and solution.
What is the average of expenses of clothing and rent.
A. Rs. 1443.75
B. Rs. 1344.57
C. Rs. 1574.34
D. Rs.1734.45
Select an option to see the answer and solution.
What is the total monthly income of the family?
A. Rs. 8025
B. Rs. 8250
C. Rs. 8520
D. Rs. 8052
Select an option to see the answer and solution.
What is the ratio of expenses on food and miscellaneous?
A. 3 : 4
B. 3 : 2
C. 2 : 3
D. 2 : 5
Select an option to see the answer and solution.
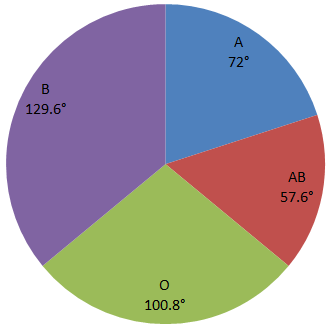
Directions (1 - 4): This is a pie chart for the data on A, B, O, AB blood groups of 150 donors. Observe the pie chart and answer the questions.
Options are not available for this question.
Select an option to see the answer and solution.
The ratio of donors blood group ‘A’ to the average of the donors group ‘O’, ‘B’ and ‘AB’ is:
A. 4 : 3
B. 4 : 5
C. 5 : 4
D. 3 : 4
Select an option to see the answer and solution.
The number of persons having either blood group ‘A’ or blood group ‘B’ is:
Select an option to see the answer and solution.
The number of donors having group ‘O’ is:
Select an option to see the answer and solution.
What is the percentage of donors having blood group ‘AB’ ?
Select an option to see the answer and solution.