Vidyalelo
Data Interpretation · all questions

Data Interpretation
practice.

Practice every MCQ with options. Use Show answers when you want the correct option and solution.

101

Questions

3/6

Page

Pick an option on a question to see the right answer and solution.

What is the ratio of the number of students appearing for the Aptitude Test from Towns C and D together to the number of students appearing for the Aptitude Test from Towns A, D and E together?

Select an option to see the answer and solution.

What is the average number of students appearing for the Aptitude Test from all the towns together?

Select an option to see the answer and solution.

The number of students appearing for the Aptitude Test from Town D is approximately what percentage of the number of students appearing for the Aptitude Test from Town C?

Select an option to see the answer and solution.

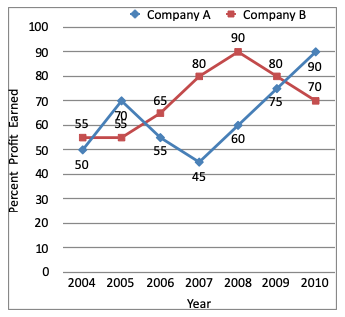
Directions (1 - 8): Study the following graphs carefully and answer the questions that follow:
Percent Profit Earned By Companies A and B Producing Electronic Goods Over The Years.
Percent Profit =
Profit Earned = (Total income ) - ( Total Investment in the Year)
Direction image of Line Chart chapter

Options are not available for this question.

Select an option to see the answer and solution.

If the investment of company A in 2007 and 2008 were equal, what is the difference between the profit earned in the two years if the income in 2008 was Rs. 24 lakh?

Select an option to see the answer and solution.

If the total amount invested by the two companies in 2009 was Rs. 27 lakh, while the amount invested by Company B was 50% of the amount invested by Company A, what was the total profit earned by the two companies together?

Select an option to see the answer and solution.

If the amount of profit earned by Company A in 2006 was Rs. 10.12 lakh, what was the total investment?

Select an option to see the answer and solution.

If the amount invested by the two companies in 2005 were equal, what was the ratio of the total income of Company A to that of B on 2005?

Select an option to see the answer and solution.

If the income of Company A in 2007 and that in 2008 were equal and the amount invested in 2007 was Rs. 12 lakh, what was the amount invested in 2008?

Select an option to see the answer and solution.

If each of the companies A and B invested Rs. 25 lakh in 2010, what was the average profit earned by the two companies?

Select an option to see the answer and solution.

If the profit earned in 2006 by Company B was Rs. 812500, what was the total income of the company in that year?

Select an option to see the answer and solution.

If the amount invested by Company B in 2004 is Rs. 12 lakh and income of 2004 is equal to the investment in 2005, what is the amount of profit earned in 2005 by Company B?

Select an option to see the answer and solution.

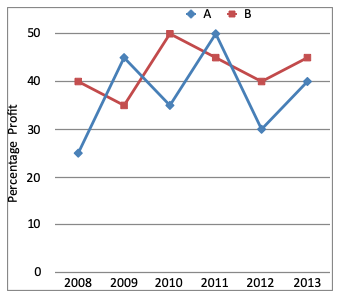
Directions (1 - 5): Study the following graph carefully and answer the questions given below it.
Percentage profit earned by two companies A and B over the six years.
Direction image of Line Chart chapter
A 25 45 35 50 30 40
B 40 35 50 45 40 45

Options are not available for this question.

Select an option to see the answer and solution.

Expenditure of company B in 2009 and 2010 are Rs. 12 lakhs and Rs. 14.5 lakhs respectively. What was the total income of company B in 2009 and 2010 together (in lakh rupees)?

Select an option to see the answer and solution.

Total expenditure of company A in all the years together was 82.5 lakhs. What was the total income of the company A in all the years together?

Select an option to see the answer and solution.

If the income of company B in 2010 and 2011 were in the ratio of 2:3 respectively, what was the respective ratio of expenditures of that company in these two years?

Select an option to see the answer and solution.

Ratio of expenditures of company A and B in 2012 was 3 : 4 respectively. What was the respective ratio of their income in 2012?

Select an option to see the answer and solution.

If the expenditure of company A and B in 2013 were equal and the total incomes of the two companies was Rs. 5.7 lakhs. what was the total expenditure of the two companies in 2013?

Select an option to see the answer and solution.

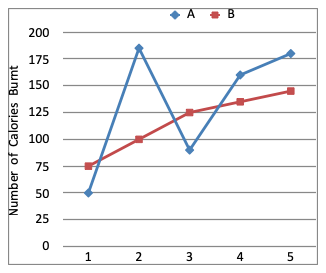
Direction (1 - 5): Refer to the graph and answer the given questions.
Data Related to Number of Calories Burned by two Individuals (A and B) on Treadmill during 5 Days.

Direction image of Line Chart chapter
  Monday Tuesday Wednesday Thursday Friday
A 50 185 90 160 180
B 75 100 125 135 145

Options are not available for this question.

Select an option to see the answer and solution.

What is the total number of calories burned by A on Tuesday, Wednesday and Thursday together?

Select an option to see the answer and solution.