If the average number of calories burned by B on Thursday, Friday and Saturday together is 125, what was the number of calories burned by B on Saturday?
If the number of calories burned by A and B increased by 10% and 20% respectively from Friday to Saturday, what was the total number of calories burned by them together on Saturday?
Directions (1 - 5): Refer to the graph and answer the given questions:
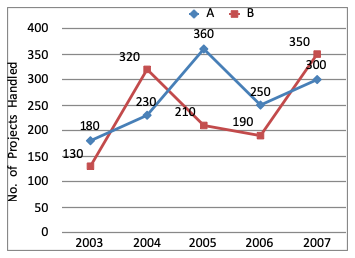
Data related to the number of projects handled by two companies A and B over 5 years.
The projects handled by a company can be broadly classified into two types: governmental projects and non-governmental projects. If the average number of non-governmental projects handles by the same company B in 2003 and 2004 is 127. What is the total number of governmental projects handled by the same company in 2003 and 2004 together?
What is the difference between the total numbers of projects handled by company A in 2003 and 2004 together and the total number of projects handled by company B in 2005 and 2007 together?
Out of the total number of projects handled by company A in 2005 and 2006 together, 20% were governmental projects. What was the total number of governmental projects handled by company A in 2005 and 2006 together?
If the number of projects handled by company A increased by 20% from 2007 to 2008 and by 5% from 2008 to 2009, what was the number of projects handled by company A in 2009?
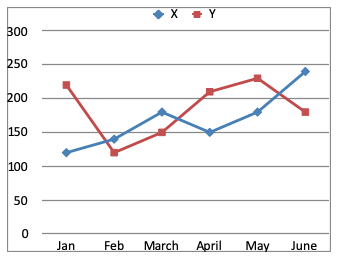
The number of watches sold in Town X in July was 10% more than the number of watches sold in the same town in May. What is the ratio of the number of watches sold in July to that sold in January in the same town?
What is the difference between the total number of watches sold in both the towns together in June and the total number of watches sold in both the towns together in March?