If the income shows positive growth every year throughout the period (2000-2005), then in how many years the expenditure shows a positive growth?
Select an option to see the answer and solution.
Find the percentage decrease in income from 2001 to 2002.
A. 50%
B. 33%
C. 25%
D. Data inadequate
Select an option to see the answer and solution.
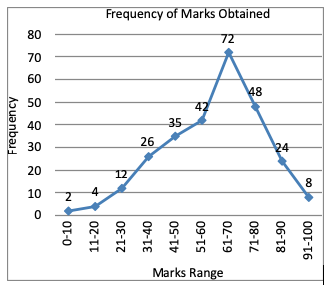
Directions (1 - 4): The marks obtained by 273 examinees are shown by the frequency polygon. Given that mean marks is 59.5. Study the frequency polygon and answer the given questions.
Options are not available for this question.
Select an option to see the answer and solution.
The number of examinees getting more than average marks is:
Select an option to see the answer and solution.
If 40 is the pass marks, percentage of students failed is-
A. 14.56%
B. 15.84%
C. 16.11%
D. 17.25%
Select an option to see the answer and solution.
Percentage of the students who get above 80% marks is-
A. 9.81%
B. 10.53%
C. 11.28%
D. 11.72%
Select an option to see the answer and solution.
Percentage of the students who got marks above 60% and below 80% is-
A. 43.95%
B. 48.39%
C. 51.06%
D. 56.84%
Select an option to see the answer and solution.
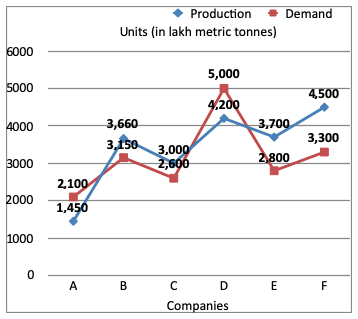
Directions (1 - 3): The graph shows the demand and production of different companies. Study the graph and answer the given questions.
Options are not available for this question.
Select an option to see the answer and solution.
The production of company A is approximately what percent of the demand of company C?
Select an option to see the answer and solution.
What is the ratio of the companies having more demand then production to those having more production than demand?
A. 1 : 2
B. 2 : 3
C. 2 : 1
D. 3 : 2
Select an option to see the answer and solution.
The demand of company B is what percentage of the production of company A?
Select an option to see the answer and solution.
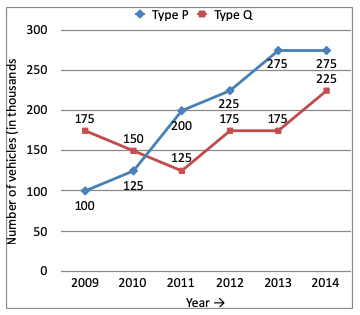
Directions (1 - 5): The following graph shows productions (in thousands) of two types (P and Q) of vehicles by a factory over the years 2009 to 2014. Study the graph and answer five questions.
Options are not available for this question.
Select an option to see the answer and solution.
The total production of Type P vehicles in the year 2009 and 2011 is what percent of total production of Type Q vehicles in 2010 and 2014?
A. 81.25%
B. 75%
C. 80%
D. 69.25%
Select an option to see the answer and solution.
Approximate percentage decrease in production of Types Q vehicles from 2010 to 2011 is:
A. 14.3%
B. 10.1%
C. 16.3%
D. 12.5%
Select an option to see the answer and solution.
The production of type Q vehicles in 2010 was approximately what percent of Type P vehicles in 2014?
Select an option to see the answer and solution.
The ratio of total production of type P vehicles to total production of Type Q vehicles over the years is:
A. 41 : 48
B. 5 : 8
C. 8 : 5
D. 48 : 41
Select an option to see the answer and solution.
In how many of the given years, was the production of Type P vehicles of the company more than the average production of this type vehicles in the given years?
Select an option to see the answer and solution.
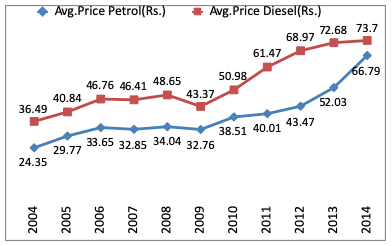
Direction (1 - 3): Observe the graph below and answer the following questions.
Options are not available for this question.
Select an option to see the answer and solution.
What is the average of diesel prices over the years 2006 - 2012?
A. 36.47
B. 37.34
C. 35.67
D. 38.77
Select an option to see the answer and solution.
What is the approximate percentage difference in average price of petrol in 2004 and 2014?
Select an option to see the answer and solution.