Vidyalelo
Data Interpretation · all questions

Data Interpretation
practice.

Practice every MCQ with options. Use Show answers when you want the correct option and solution.

184

Questions

2/10

Page

Pick an option on a question to see the right answer and solution.

If the price of B is Rs. 125 per unit, what is the sales revenue in the same year due to sale of B (in Rupees Lakhs)?

Select an option to see the answer and solution.

Assuming no pile up of inventory at the beginning or the end of the year, what is the ratio of the number of units of C produced in these four years?

Select an option to see the answer and solution.

If the price of four products is in ratio of 3 : 5 : 7 : 8, what is the ratio of the ratio of the revenue generated by these products in 2002?

Select an option to see the answer and solution.

If due to extra set up time required, the production in 2001 drops by 12.5% over that in 2000, what should be the growth rate of production in 2002 to maintain the compounded annual growth rate (CAGR) of 20% (Approx)?

Select an option to see the answer and solution.

Which of the following is Not true?

Select an option to see the answer and solution.

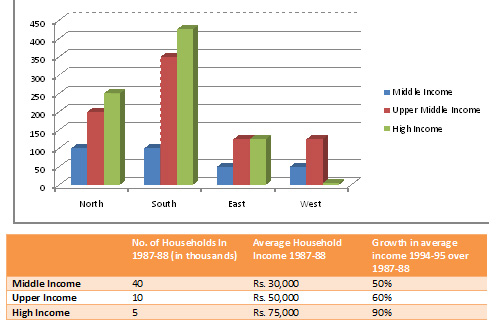
Directions (1 - 4) The following bar chart gives the growth percentage in the number of households in middle, upper-middle and high-income categories in the four regions for the period between 1987-88 and 1994-95.
Bar Chart direction image

Options are not available for this question.

Select an option to see the answer and solution.

Which region showed the highest growth in number of households in all the income categories for the period ?

Select an option to see the answer and solution.

What was the total household income in northern region for upper-middle class ?

Select an option to see the answer and solution.

What is the percentage increase in total number of households for the northern region (upper-middle) over the given period ?

Select an option to see the answer and solution.

What was the average income of the high-income group in 1987-88?

Select an option to see the answer and solution.

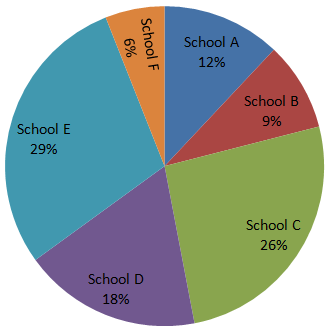
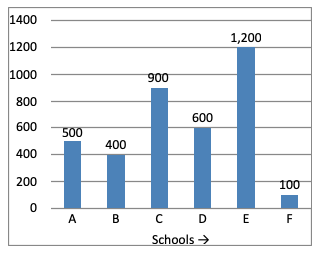
Directions (1 - 5): study the following pie chart and bar diagram and answer the following questions.
Percentage-wise Distribution of students in 6 Different Schools. Total number of students = 6000.
Direction image of Bar Chart chapter
Number of Boys in Each School Out of 6000 Student
Direction image of Bar Chart chapter

Options are not available for this question.

Select an option to see the answer and solution.

What is the ratio of the number of boys in school C, the number of girls in school B and the total number of students in school E?

Select an option to see the answer and solution.

The number of girls school A is approximately what percentage of the total number of students in school B?

Select an option to see the answer and solution.

What is the sum of the number of girls in school C, the number of girls in school E and the number of boys in school D together?

Select an option to see the answer and solution.

What is the difference between the total number of students in school F and the number of boys in school E?

Select an option to see the answer and solution.

In which of the following schools is the total number of students equal to the number of girls in school E?

Select an option to see the answer and solution.

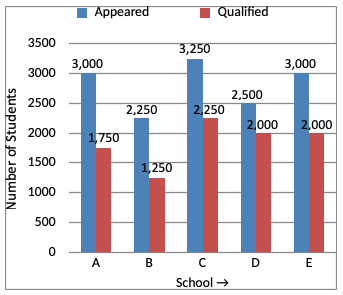
Directions (1 - 5): Study the following graph carefully and answer the questions given below:
Total Number of Students Appeared and Qualified from Various Schools at a Scholarship Exam.
Direction image of Bar Chart chapter

Options are not available for this question.

Select an option to see the answer and solution.

What is the ratio of the number of students appeared to the number of students qualified at the scholarship exam from School C?

Select an option to see the answer and solution.

What is the difference between the average number of students appeared in the scholarship exam from all the given schools and the average number of students qualified from all the school together?

Select an option to see the answer and solution.

What is the ratio of the number of students qualified in the scholarship examination from School A and the number of students qualified in the examination from School B?

Select an option to see the answer and solution.