Vidyalelo
Data Interpretation · all questions

Data Interpretation
practice.

Practice every MCQ with options. Use Show answers when you want the correct option and solution.

184

Questions

3/10

Page

Pick an option on a question to see the right answer and solution.

The average number of students qualified in the examination from Schools C and D is what percent of the average number of students appeared for the examination from the same school? ( round off to 2 digits after decimal).

Select an option to see the answer and solution.

The number of students appeared for the scholarship exam from School D is approximately what percent of the total number of students appeared for the exam from all the school together?

Select an option to see the answer and solution.

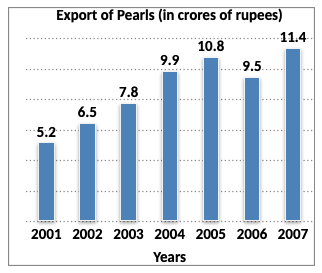
Directions (1 - 5): Study the following bar-graph carefully and answer the questions given below:
Direction image of Bar Chart chapter

Options are not available for this question.

Select an option to see the answer and solution.

In how many years was the export above average for the given period?

Select an option to see the answer and solution.

What was the percentage increase in export from 2006 to 2007 ?

Select an option to see the answer and solution.

The average export of pearls for the given period (in Rs. crores) was ?

Select an option to see the answer and solution.

In which of the following pairs of years was the average export of pearls around Rs. 9 crores?

Select an option to see the answer and solution.

In which year was there maximum percentage increase in export of pearls to that in the previous year?

Select an option to see the answer and solution.

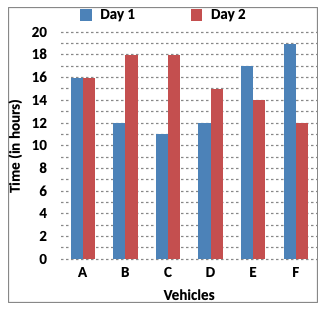
Direction (1 - 5): Study the following bar graph and the table carefully and answer the questions given below:
Time Taken (in hours) by 6 Vehicles on Two Different Days
Direction image of Bar Chart chapter
Distance Covered (in km) by 6 Vehicles on Each Day
Vehicles Day 1 Day 2
A 832 864
B 516 774
C 693 810
D 552 765
E 935 546
F 703 636

Options are not available for this question.

Select an option to see the answer and solution.

Which of the following vehicles travelled at the same speed on both the days?

Select an option to see the answer and solution.

What was the speed of vehicles C on Day 2 in terms of metres per second ?

Select an option to see the answer and solution.

What is the ratio of the speeds of vehicle D and vehicle E on Day 2?

Select an option to see the answer and solution.

What was the difference between the speed of vehicles A on Day 1 and the speed of vehicles C on the same day ?

Select an option to see the answer and solution.

The distance travelled by vehicle F on Day 2 was approximately what percent of the distance travelled by it on Day 1?

Select an option to see the answer and solution.

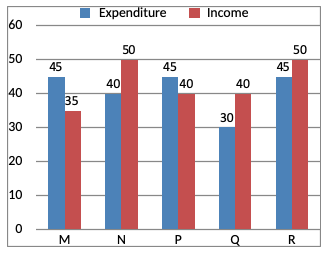
Directions (1 - 5): Study the bar chart given below and answer the following questions:
Income and Expenditure (in Rs. crore) in 2001 of five companies
Direction image of Bar Chart chapter

Options are not available for this question.

Select an option to see the answer and solution.

The company earning the maximum percentage of profit in the year 2001 is:

Select an option to see the answer and solution.

In 2001, the approximate percentage of profit/loss of all the five companies taken together is equal to-

Select an option to see the answer and solution.

For company R if the expenditure had increased by 20% in the year 2001 from the year 2000 and the company had earned profit of 10% in 2000, the company’s income in 2000 was (in Rs. crore).

Select an option to see the answer and solution.

If the income of company Q in 2001 was 10% more than that in 2000 and the company had earned a profit of 20% in 2000, then its expenditure in 2000 (in Rs. crore).

Select an option to see the answer and solution.

The companies M and N together had a percentage of profit/ loss of -

Select an option to see the answer and solution.