Vidyalelo
Data Interpretation · all questions

Data Interpretation
practice.

Practice every MCQ with options. Use Show answers when you want the correct option and solution.

184

Questions

8/10

Page

Pick an option on a question to see the right answer and solution.

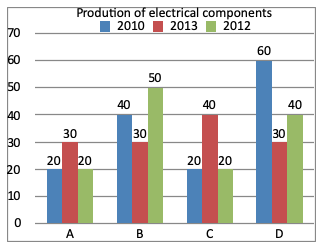
Directions (1 - 4): Study the following graph carefully and answer the given questions.
Direction image of Bar Chart chapter

Options are not available for this question.

Select an option to see the answer and solution.

What is the ratio between average production by company B in three years to the average production by company C in three years?

Select an option to see the answer and solution.

Which company has the highest average production over the three years?

Select an option to see the answer and solution.

Which the drop in production of company D from year 2010 to 2012 in percentage?

Select an option to see the answer and solution.

The total production of companies A and D in year 2010 is what percent of total production of four companies in the year 2012?

Select an option to see the answer and solution.

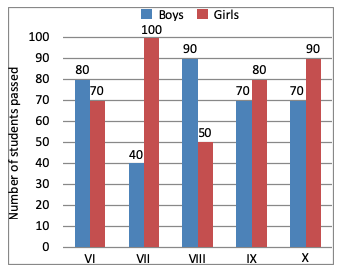
Directions (1 - 4): The bar graph shows the results of an annual examination in a secondary school in a certain year. Answer the following four questions based on this chart.
Direction image of Bar Chart chapter

Options are not available for this question.

Select an option to see the answer and solution.

The ratio of the total number of boys passed to the total number of girls passed in the three classes VII, VIII and IX is:

Select an option to see the answer and solution.

The average number of boys passed per class per class is:

Select an option to see the answer and solution.

The class in which the number of boys passed is nearest to the average number of girls passed per class, is-

Select an option to see the answer and solution.

The class having the highest number of passed students, is:

Select an option to see the answer and solution.

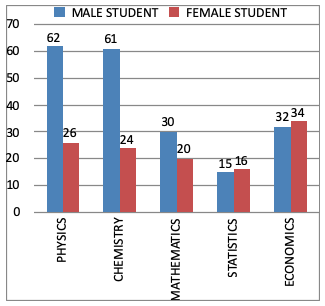
Directions (1 - 4): The data given in bar diagram relate to the department wise admission of 320 students to B Sc. (Honors) first year classes of a certain college in the given five subjects. Study the graph and answer the questions.
Direction image of Bar Chart chapter

Options are not available for this question.

Select an option to see the answer and solution.

The subject in which the difference in the number of male and female students is minimum in:

Select an option to see the answer and solution.

The total number of male students who got admitted in mathematics and economics as compared to the total number of female students getting admission in mathematics and economics is:

Select an option to see the answer and solution.

The difference of the choice of the subject between male and female students is maximum for the subject.

Select an option to see the answer and solution.

The subject which the female student are finding difficult as compared to other subject is:

Select an option to see the answer and solution.

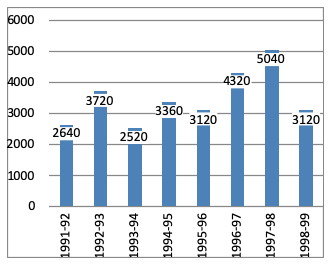
Directions (1 - 4): The graph shows the exchange reserve of a country in difference years. Study the graph and answer the questions.
Direction image of Bar Chart chapter

Options are not available for this question.

Select an option to see the answer and solution.

Ratio of the sum of exchange during the year 1991-92, 1992-93, 1993-94, to that during the years 1995-96, 1996-97 and 1997-98 is:

Select an option to see the answer and solution.

The exchange reserves in 1996 - 1997 were approximately what percent of the average exchange reserve over the period under review?

Select an option to see the answer and solution.

The percentage increase in the foreign exchange reserves in 1997 - 98 over 1993 - 94 is:

Select an option to see the answer and solution.

The ratio of number of years, in which the foreign exchange reserves are above the average reserves, to those in which the reserves are below the average reserves is:

Select an option to see the answer and solution.