Q101
Open questionFor which models was the percentage variation in production from 2007 to 2008 the maximum?
Select an option to see the answer and solution.

Practice every MCQ with options. Use Show answers when you want the correct option and solution.
184
Questions
6/10
Page
Pick an option on a question to see the right answer and solution.
Q101
Open questionSelect an option to see the answer and solution.
Q102
Open questionSelect an option to see the answer and solution.
Q103
Open question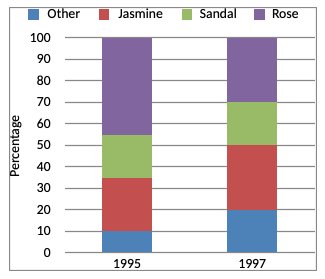
Options are not available for this question.
Select an option to see the answer and solution.
Q104
Open questionSelect an option to see the answer and solution.
Q105
Open questionSelect an option to see the answer and solution.
Q106
Open questionSelect an option to see the answer and solution.
Q107
Open question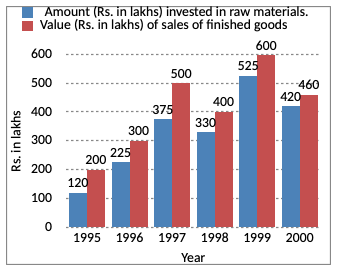
Options are not available for this question.
Select an option to see the answer and solution.
Q108
Open questionSelect an option to see the answer and solution.
Q109
Open questionSelect an option to see the answer and solution.
Q110
Open question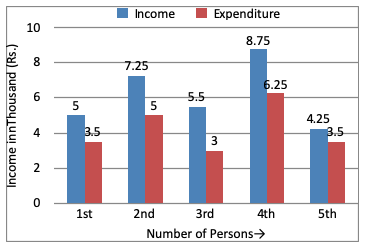
Options are not available for this question.
Select an option to see the answer and solution.
Q111
Open questionSelect an option to see the answer and solution.
Q112
Open questionSelect an option to see the answer and solution.
Q113
Open question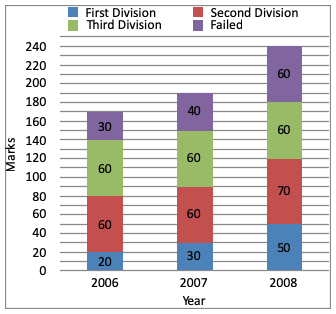
Options are not available for this question.
Select an option to see the answer and solution.
Q114
Open questionSelect an option to see the answer and solution.
Q115
Open questionSelect an option to see the answer and solution.
Q116
Open questionSelect an option to see the answer and solution.
Q117
Open question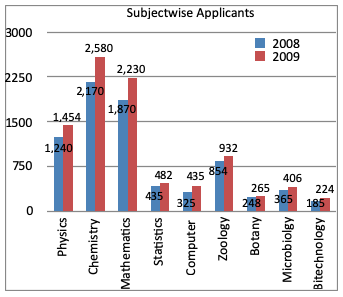
Options are not available for this question.
Select an option to see the answer and solution.
Q118
Open questionSelect an option to see the answer and solution.
Q119
Open questionSelect an option to see the answer and solution.
Q120
Open questionSelect an option to see the answer and solution.