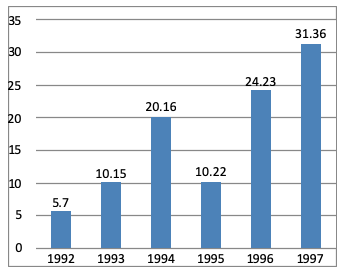
Direction (1 - 4): Study the bar diagram carefully and answer the questions. The bar diagram shows the trends of foreign direct investment (FDI) into India from all over the World (in Rs. crores).
Options are not available for this question.
Select an option to see the answer and solution.
The difference between FDI of 1997 and 1996.
Select an option to see the answer and solution.
The sum of FDI of 1992 and 1993 is.
A. 15.58 cr
B. 15.85 cr
C. 15.22 cr
D. 15.65 cr
Select an option to see the answer and solution.
The ratio of investment in 1997 to the average investment is:
A. 2 : 1
B. 1 : 2
C. 1 : 1
D. 3 : 1
Select an option to see the answer and solution.
The year which exhibited the 2nd highest growth percentage in FDI in India over the period shown is:
Select an option to see the answer and solution.
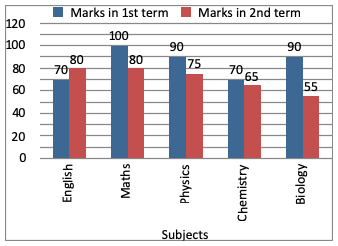
Directions (1 - 4): Study the bar diagram and answer the following questions.
Options are not available for this question.
Select an option to see the answer and solution.
The ratio of the average of the marks obtained in Biology for two terms to the average of the marks obtained in English and Mathematics for first term only is:
A. 43 : 92
B. 39 : 42
C. 29 : 34
D. 23 : 94
Select an option to see the answer and solution.
Average marks obtained in physics for two terms is-
A. 80. 5
B. 82.5
C. 72.5
D. 83.5
Select an option to see the answer and solution.
What is the percentage of marks obtained in chemistry for both the terms?
Select an option to see the answer and solution.
Difference of marks obtained in both the terms by the students is maximum in:
A. English
B. Physics
C. Biology
D. Mathematics
Select an option to see the answer and solution.
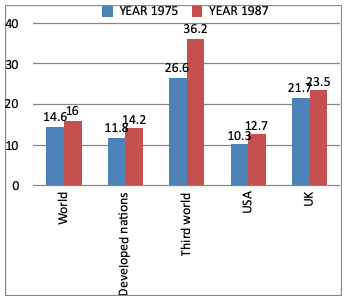
Direction (1 - 3): Study the following bar graph and answer the questions. The Bar graph gives the annual rates of inflation in percentage for 1975 and 1987.
Options are not available for this question.
Select an option to see the answer and solution.
Comparing the figures for USA vis-a-vis the developed nations, it can be concluded that.
A. USA had better control on inflation
B. Developed nations had better control on inflation
C. Continues to be the same for USA and developed nations
D. No conclusions can be drawn
Select an option to see the answer and solution.
From 1975 to 1987, inflation rate increased in the third world countries approximately by:
Select an option to see the answer and solution.
The change in rate of inflation was least in which of the following.
A. Developed Nations
B. UK
C. World
D. Third world
Select an option to see the answer and solution.
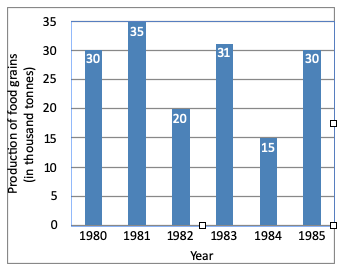
Directions (1 - 4): The graph shows the production of food grains of a country in different. Study the graph and answer the questions.
Options are not available for this question.
Select an option to see the answer and solution.
The two consecutive years in which rate of change of production of food grains is minimum are.
A. 1980 and 1981
B. 1982 and 1983
C. 1984 and 1985
D. 1983 and 1984
Select an option to see the answer and solution.
The difference of the production of food grains for the year 1981 and 1985 is:
A. 500 tonnes
B. 1000 tonnes
C. 5000 tonnes
D. 10000 tonnes
Select an option to see the answer and solution.
The percentage increase in production from 1984 to 1985 was.
Select an option to see the answer and solution.
The sum of the production of food grains in the year 1982 and 1984 is equal to that in the year:
Select an option to see the answer and solution.
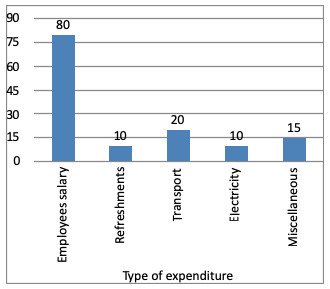
Directions (1 - 4): The graph shows the monthly expenditure of a company ( unit = 10 lakh). Study the graph and answer the questions.
Options are not available for this question.
Select an option to see the answer and solution.