Directions (1 - 5): Study the following graph carefully to answer the questions that follow:
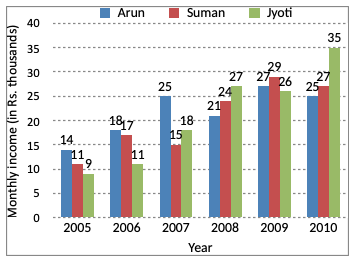
Monthly income (Rs. in thousands) of three different persons in six different years
What is the respective ratio between Arun’s monthly income in the year 2006, Suman’s monthly income in the year 2007 and Jyoti’s monthly income in the year 2005?
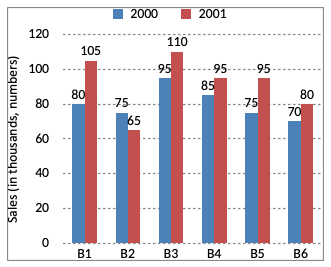
Directions (1 - 5): The bar graph given below shows the sales of books (in thousand numbers from six branches of a publishing company during two consecutive years 2000 and 2001. Sales of books (in thousands numbers) from six branches B1, B2, B3, B4, B5 and B6 of a publishing company in 2000 and 2001.
Directions (1 - 5): Study the following graph carefully and answer the questions that follow:
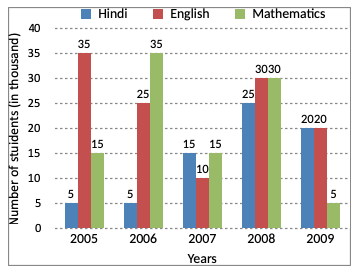
No. Of students (in thousands) who opted for Three Different Specializations during the Given Five Years in a University.
If the total number of students in the university in the year 2007 was 455030, the total number of students who opted for the given three subjects was approximately what percent of the total students?