Vidyalelo
Data Interpretation · all questions

Data Interpretation
practice.

Practice every MCQ with options. Use Show answers when you want the correct option and solution.

184

Questions

5/10

Page

Pick an option on a question to see the right answer and solution.

What is the ratio of the number of students who opted for English in the years 2006 and 2008 together to the number of students who opted for Hindi in the years 2005 and 2009 together?

Select an option to see the answer and solution.

What is the total number of students who opted for Hindi and Mathematics in the years 2006, 2007 and 2009 together?

Select an option to see the answer and solution.

Out of the total number of students who opted for the given three subjects in the year 2009, 38% were girls. How many boys opted for Mathematics in the same year?

Select an option to see the answer and solution.

The total number of students who opted for Mathematics in the years 2005 and 2008 together is approximately what percent of the total number of students who opted for all three subjects in the same years?

Select an option to see the answer and solution.

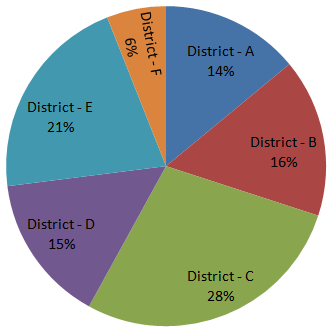
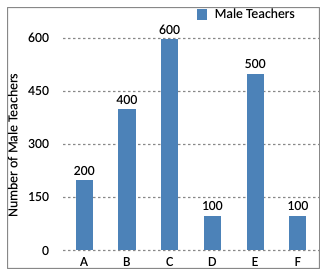
Directions (1 - 5): Study the following pie-chart and bar graph and answer the questions that follows:
Percentage-wise distribution of Teachers in 6 Districts.
Direction image of Bar Chart chapter
Number of males in each district out of 4500 Teachers.
Direction image of Bar Chart chapter

Options are not available for this question.

Select an option to see the answer and solution.

What is the total number of male teachers in District F, female teachers District C and female teachers in District B together?

Select an option to see the answer and solution.

In which district is the number of male teachers more than the number of female teachers?

Select an option to see the answer and solution.

What is the ratio of the number of male teachers in District C to the number of female teachers in District B?

Select an option to see the answer and solution.

The number of female teachers in District D is approximately what percent of the total number of teachers (both male & female) in District A?

Select an option to see the answer and solution.

What is the difference between the number of female teachers in District F and the total number of teachers (both male and female) in District E?

Select an option to see the answer and solution.

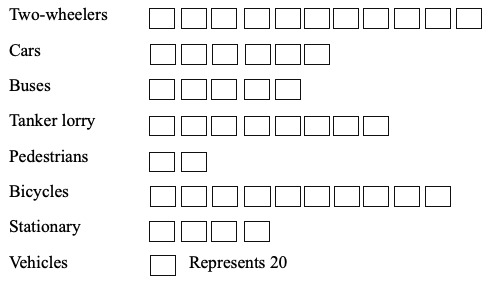
Directions (1 - 5): The following is a horizontal bar diagram showing the accidents in which two-wheelers are involved with other objects. Study the diagram and answer the questions.
OBJECTS HIT
Bar Chart direction image

Options are not available for this question.

Select an option to see the answer and solution.

The difference in percentage between the accidents involving two-wheelers and other objects is respectively.

Select an option to see the answer and solution.

The percentage of accidents in which pedestrians and cyclists are involved is -

Select an option to see the answer and solution.

60% of the accidents are involved due to

Select an option to see the answer and solution.

The percentage by which the accidents involving buses is less than the accidents involving tanker lorry is-

Select an option to see the answer and solution.

If the data of the bar diagram is represented by a pie-chart, and the angle of a sector of the pie-chart is 36°, then this sector represents the accidents involving.

Select an option to see the answer and solution.

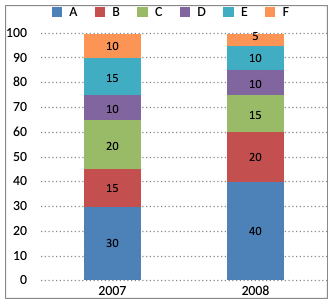
Directions (1 - 5): The bar chart given below shows the percentage distribution of the production of various models of a mobile manufacturing company in 2007 and 2008. The total production in 2007 was 35 lakh mobile phones and in 2008 the production was 44 lakh. Study the chart and answer the following questions.
Percentage of six different types of mobiles manufactured by a company over two year.

Direction image of Bar Chart chapter

Options are not available for this question.

Select an option to see the answer and solution.

If 85% of the D type mobile produced in each year were sold by the company, how many D type mobiles remained unsold?

Select an option to see the answer and solution.

Total number of mobiles of models A, B and E manufactured in 2007 was?

Select an option to see the answer and solution.

If the percentage production of A type mobiles in 2008 as name as that in 2007, then the number of A type mobiles produced in 2008 would have been-

Select an option to see the answer and solution.